
RVTools is a free Windows .NET application which uses the VI SDK to collect information about virtual machines and ESXi hosts. RVTools is capable of exporting a complete inventory of a vSphere environment along with point-in-time utilization data.
Note
While RVTools only supports VMware environments, similar reports can be generated for other hypervisors using alternate tools.
For Hyper-V, see Hyper-V Reporting Script.
For XenServer, export Resource Data using XenCenter.
Download the RVTools Installer.
Launch the RVTools Installer and complete the installation wizard.
Launch RVTools and provide the following:
RVTools will collect a complete inventory and display on screen.
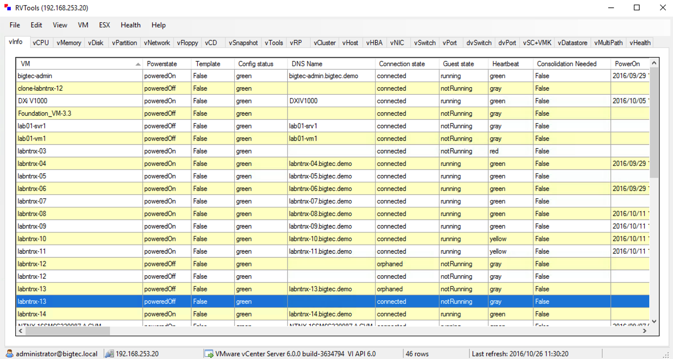
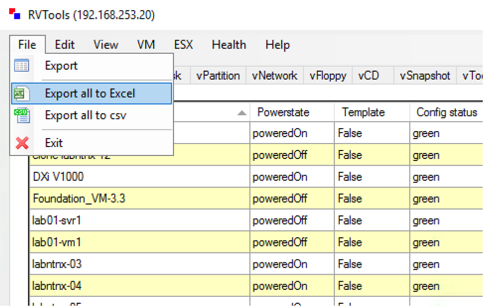
Select File > Export all to Excel.
Select a directory and click Save.
A standard RVTools export is comprised of many tabs, including vInfo, vCPU, vMemory, vDisks, vPartitions, vHosts, vNetwork, vCD, vFloppy, etc. As a matter of preference, non-essential tabs can be hidden or deleted.
Similarly, each tab contains many non-essential columns that can be hidden or deleted. The remainder of this guide will focus on the essential data, with additional data already removed.
Separate multiple virtual clusters into separate workloads for sizing purposes. Separate clusters may continue to be separate environments running on Nutanix. Even in a scenario where multiple clusters are being consolidated, gathering sizing information separately will allow you to right-size for things like vCPU:pCore ratio.
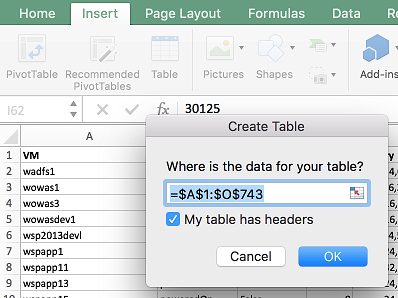
Add range data on each tab into a table to easily sort and filter. Select the desired tab in Excel and click Insert > Table. Ensure My table has headers is selected and click OK.
The information most relevant to sizing can be extracted from three tabs:
removing/hiding unnecessary columns (config status, DNS name, heartbeat, etc.) pay attention to description and annotation fields - helpful in identifying MC databases add to table separate clusters MB is actually MiB - so divide by 1024 divide up into different workloads based on DR requirements
vInfo provides a summary of all VMs and their core specifications, including vCPUs, Memory, Provisioned Storage, Host, Cluster, and more.
Open your RVTools spreadsheet and, as previously covered, create a table in Excel from the vInfo tab.
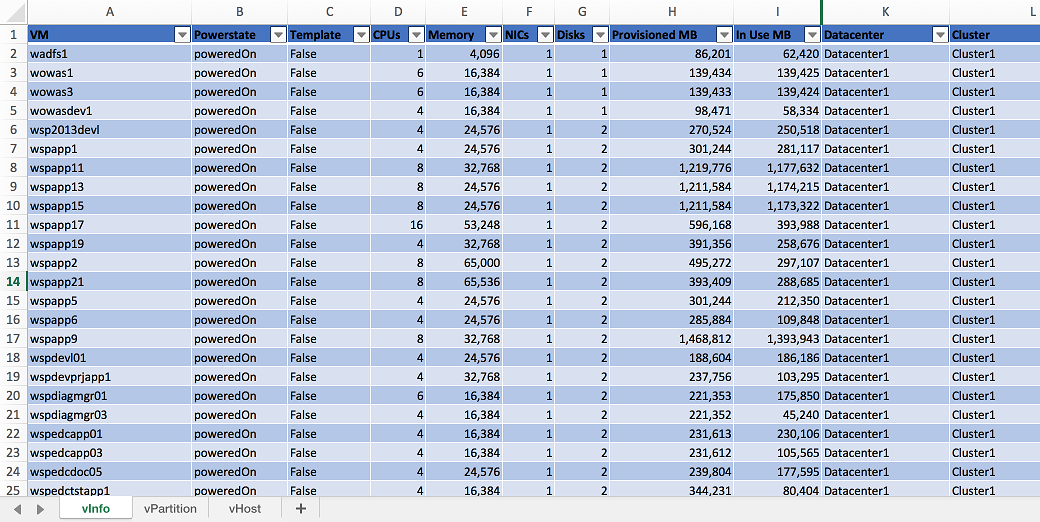
Next, in the Cluster column, select the Filter icon and select the desired cluster.
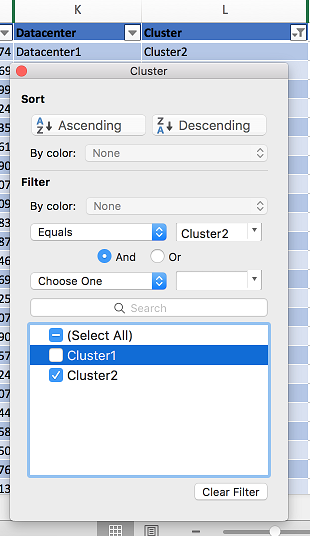
Cluster - Cluster2
In the Template column, select the Filter icon and select False. This will filter out vCPU and Memory related to VMs that will never be powered on.
Note
You should perform a quick filter of poweredOff VMs in the Powerstate to determine how many powered off VMs there are in the cluster. Typically a few powered off VMs will have negligible impact on the sizing, but if there are many powered off VMs it is worth performing additional discovery with the customer.
Do they plan to power these VMs on at any point? If yes, include the VMs from both a vCPU, memory, and storage perspective in your sizing.
Are they simply templates not flagged as templates? If yes, the VMs don’t need to count towards vCPUs and memory, but you should still account for storage.
Are these VMs not going to be migrated to Nutanix? If yes, they can be filtered out of the sizing analysis entirely.
Using the “Import RVTools” feature within Nutanix Sizer will ignore ALL PoweredOff VMs entirely. If using this feature for simple environments it is critical to manually account for any powered off VMs.
Note
You can also filter against the CPUs column for VMs with > 8 vCPUs to identify any potential mission critical workloads that should be flagged and sized as a separate workload. The reason for sizing these VMs separately is so Sizer can properly account for differences in vCPU:pCore ratio between general server workloads and workloads such as mission critical databases. Alternatively, these VMs may be Software Defined Storage controllers (e.g. Nutanix CVMs) that can be eliminated from the RVTools analysis.
The Description or Annotation columns may provide additional information, but the best course of action is to follow-up with the customer to determine if additional care and attention should be paid to these VMs.
Select the VM column to determine the total number of VMs in the cluster. The total number of VMs will be equal to the Count value minus 1 (due to the header).

Total VMs - 685
Select the CPUs column to determine the Sum of all vCPUs in the cluster.
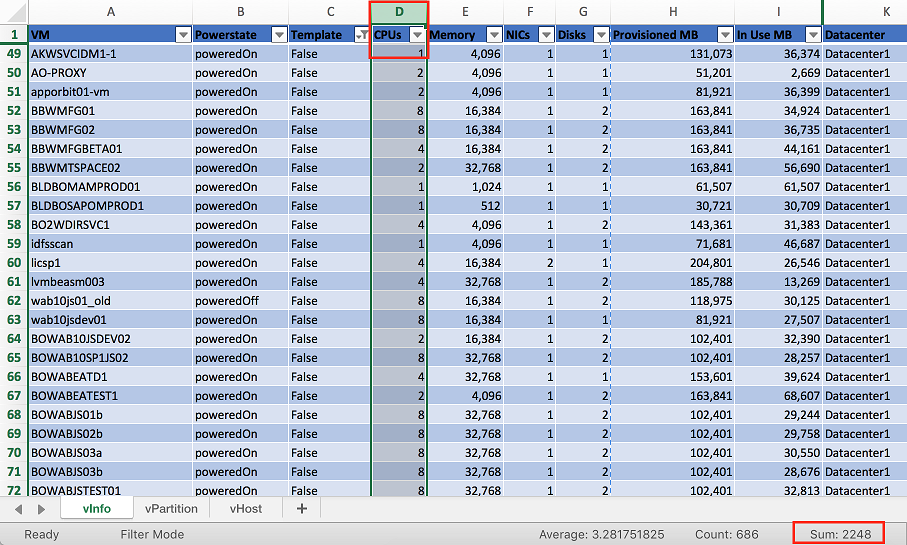
Total vCPUs - 2248
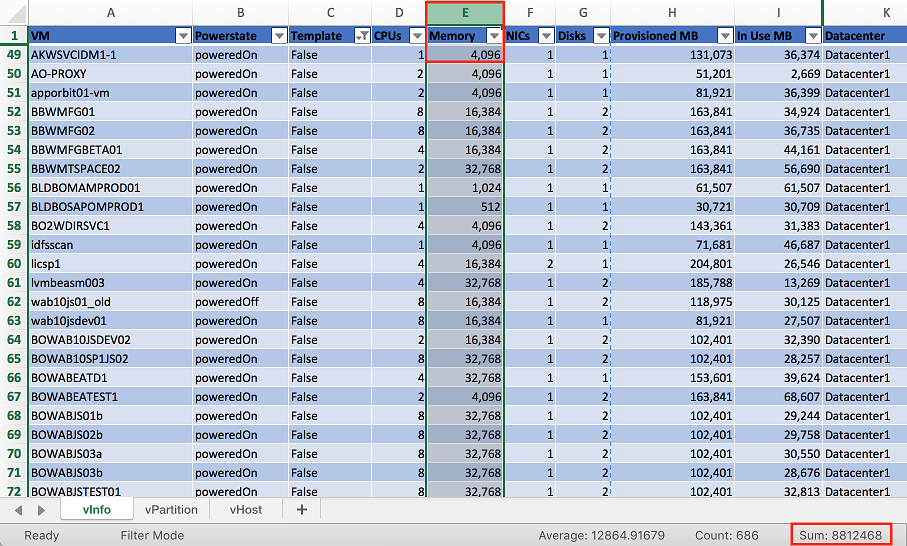
Select the Memory column to determine the Sum of all RAM assigned to VMs in the cluster. Divide by 1024 to calculate the amount of RAM in GiB.
Note
Despite vCenter and RVTools displaying values labeled MB, GB, etc., they are actually Base 2 MiB, GiB, etc. To properly convert between units, multiple or divide by 1024.
Total Memory - 8812468 MiB / 1024 = 8606 GiB
Provisioned MB represents the total storage space, in MiB, committed to a virtual machine across all datastores. In Use MB represents storage in use, in MiBs, used by this virtual machine on all datastores. However this In Use value isn’t typically useful for sizing as many environments utilize Thick Provisioned virtual disks, meaning all provisioned space is allocated up front.
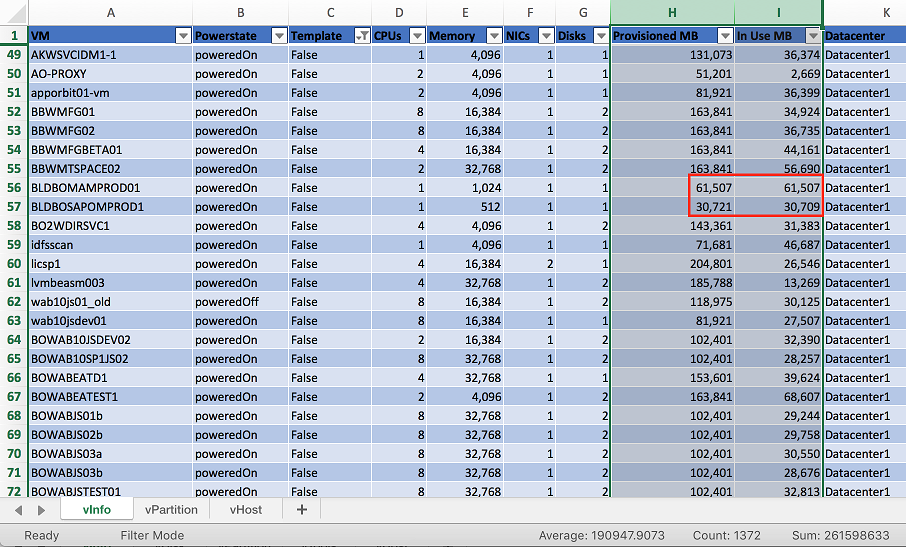
Use of Thick Provisioned virtual disks can quickly be determined via comparison of the Provisioned MB and In Use MB sums, similar or identical values indicate the use of Thick Provisioned disks. The vDisk tab also has a Thin column which provides a True/False value for each virtual disk.
Note
It is still worth noting the provisioned storage in an environment. Even though we typically size based on storage actually being utilized, the prospect we have additional factors impacting the available capacity required for a proposed solution.
vPartition provides in-guest storage utilization data provided by VMware Tools.
Note
VMware Tools is required to provide vPartition data. The vTools tab can be used to identify any VMs that do not have VMware Tools installed.
VMs do not need to be powered on to provide vPartition data. If a VM is powered off, the host will provide the storage utilization data from when the VM was last powered on.
Create a table in Excel from the vPartition tab.
Next, in the Cluster column, select the Filter icon and select the desired cluster.
Cluster - Cluster2
Select the Consumed MB column to determine the Sum of all storage currently used in the cluster. Divide by 1024 to calculate the amount in GiB. Divide again by 1024 to calculate the amount in TiB.
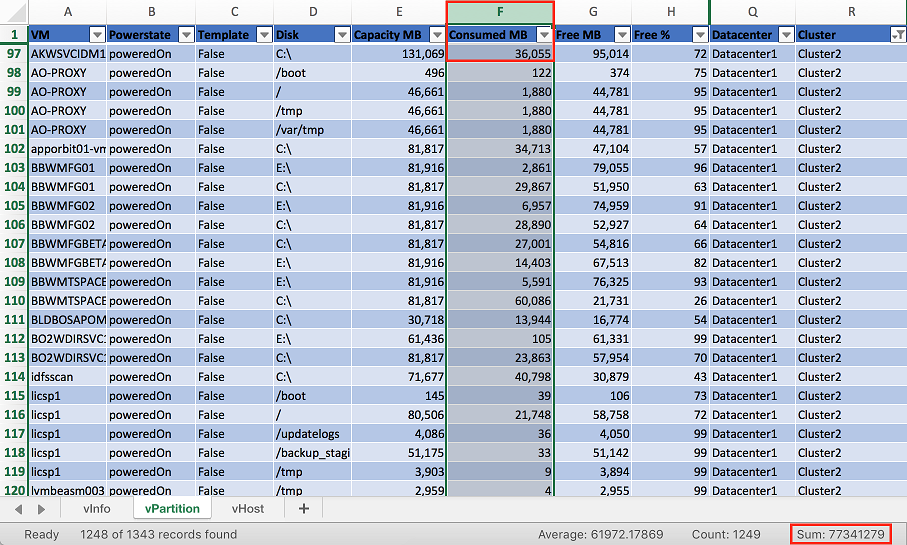
In-Guest Consumed Storage - 77341279 MiB / 1024 / 1024 = 73.8 TiB
It is also important to factor in the storage requirement for swap files used for memory oversubscription. This additional amount of capacity should equal the amount of memory provisioned for VM workloads.
Total Workload Storage - 73.8TiB + (8606GiB / 1024) = 82.2TiB
vHost provides details regarding the compute hosts in the cluster, including CPUs, memory, vendor, and model.
Create a table in Excel from the vHost tab.
Next, in the Cluster column, select the Filter icon and select the desired cluster.
Cluster - Cluster2
Note
vHost provides CPU Usage % and Memory Usage % for each host. This data is collected at the point in time that RVTools was run, and is in no way a historical representation of utilization. It should therefore not factor into sizing.
If a customer can provide additional anecdotal (peak CPU utilization doesn’t exceed X%) or historical performance monitoring data, these can be factored in.
Memory utilization is less relevant, as we size based on the amount of RAM provisioned to VMs with the assumption that memory is not being overcomitted.
Select the # Cores column to determine the Sum of all physical CPU cores (pCores) in the cluster.
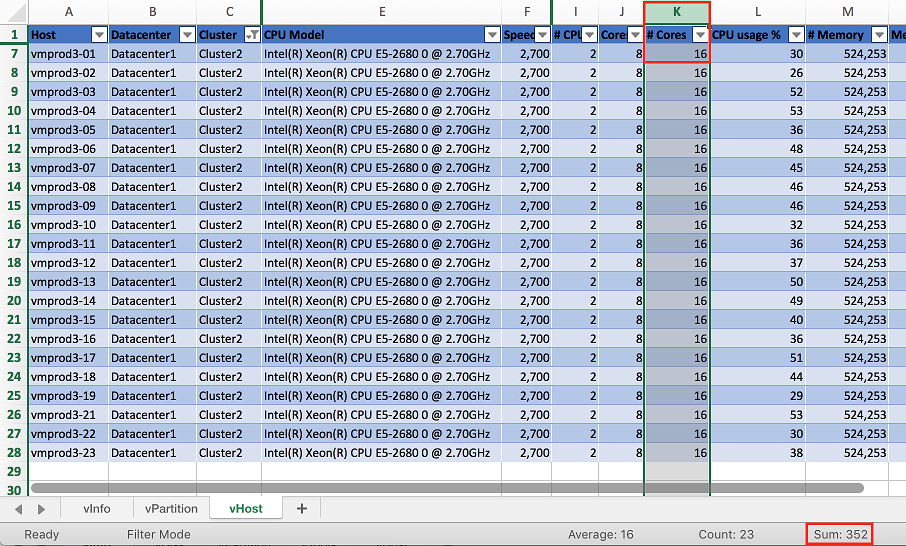
Total pCores - 352
Note
Assuming the existing cluster is sized for N+1 availability, you may want to subtract 1 host worth of pCores from the Total pCores value. In this example, the total number of cores required to run the workload would be 336 Cores, rather than 352 Cores (each host has a total of 16 cores). This will have little impact for larger cluster sizes, but can make a dramatic difference in the vCPU:pCore ratio for clusters with a smaller number of hosts.
To calculate vCPU:pCore Ratio, divide the Total vCPUs by the Total pCores.
vCPU:pCore Ratio - 2248 / 352 = 6.4:1
Note
Common vCPU:pCore ratios for general server virtualization typically range from 3:1-6:1.
If the calculated ratio falls below this range, first perform some additional discovery with the customer regarding CPU utilization. If they agree they are currently under-utilizing CPU in their existing environment (or have additional historical monitoring data that shows this), you can justify using a higher, assumed ratio.
Sizer currently defaults to a 6:1 vCPU:pCore ratio for Server Virtulization workloads. This ratio is not a hard standard. Always start by analyzing the data available.
Optionally, comparing existing CPU Model to targeted CPU model can also be used to increase vCPU:pCore ratio. Newer CPU models are capable of providing incrementally higher performance from a single core compared to previous generations, often even at lower clock speeds. This approach sees the most significant returns when comparing to CPUs that are several generations old.
Using a common CPU benchmark, such as the Passmark Single Thread Benchmark, you can determine how much additional performance to expect on a per core basis.
The Intel Xeon E5-2680v1 processor has a Passmark Single Thread score of 1657.
Hypothetically, we will target the Intel Xeon Gold 6130 processor, which has a Passmark Single Thread score of 1952.
1952 / 1657 = 1.18x greater per core performance compared to the existing CPU model.
Adjusted vCPU:pCore Ratio - 6.4:1 * 1.18 = 7.5:1
The collected values can now be summarized and used as Sizer inputs.
| Cluster Name | Total vCPUs | vCPU:pCore Ratio | Total Memory | Total Storage |
|---|---|---|---|---|
| Cluster2 | 2248 | 6.4:1 | 8606 GiB | 82.2 TiB |